Show and Tell! Great Graphs and Smart Charts: An Introduction to Infographics
(Paperback)
Available Formats
Publishing Details
Show and Tell! Great Graphs and Smart Charts: An Introduction to Infographics
By (Author) Stuart J. Murphy
By (author) Teresa Belln
Charlesbridge Publishing,U.S.
Charlesbridge Publishing,U.S.
1st November 2022
6th October 2022
United States
Classifications
Children
Non Fiction
511.5
Physical Properties
Paperback
48
Width 279mm, Height 205mm
Description
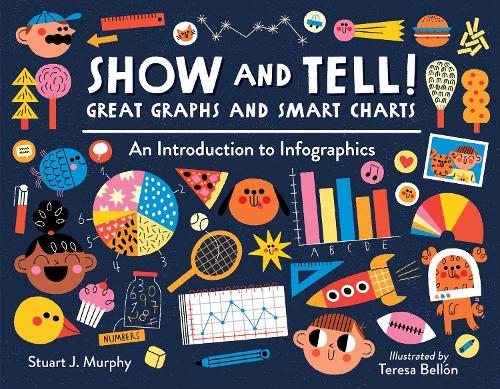
A visual-learning expert races up the charts and graphs math success with kid-friendly content sure to help with homework. Want to find the most popular meal in the cafeteria Compare town sports enrollments Or maybe you just want to know who burps the most in your family! Learn what line graphs, bar graphs, pie charts, and pictographs are and how and when to use them to represent data. Each project shows how to build a chart or graph and ties it all together with a creative infographic that really puts the A in STEAM (Science, Technology, Engineering, ARTS, and Mathematics). Whether used as an introductory aid or to underscore previous knowledge, the book prepares today's visually savvy children to succeed in school and life by analyzing the world around them.
Reviews
A project-based introduction to graphs and charts is presented with bold illustrations and engaging text as Murphy brings his wealth of kid-friendly math expertise to the world of infographics. Two classmates, a Black girl and a white boy, navigate each type of graph or chart. They explore bar graphs, pictographs, pie charts, and line graphs. With each one they focus on a real-world topic such as favorite meals, burps in a week, most common household pets in their school, and amusement park rides. Each chapter clearly explains how to gather the data, track the data on a table, and then transfer that information on to the appropriate type of visual. Dialogue bubbles between the two students add humor, while side bars show them extending the collection and interpretation of data. This title could be used as an introduction or as a refresher depending on the age group. Younger students might need a bit of front-end work with vocabulary definitions for words such as data, trend, and diagram. The book ends with suggestions for creating a personal infographic, combining many of the charts and graphs explored in the book.
VERDICT This STEAM title is a valuable purchase where math and literary nonfiction are in demand.
School Library Journal
Author Bio
Stuart J. Murphy is a visual-learning specialist and the author of the I See I Learn series and the award-winning MathStart series. He has also served as an author and consultant on a number of major educational programs. Stuart lives in Boston, Massachusetts. A native of Spain, Teresa Bell n is an artist and illustrator inspired by travel and walks in her hometown of Madrid. www.advocate-art.com/teresa-bellon
